Digital Display Solutions with Built-In Analytics Features: What to Look For?
The question “how do we know if our signage is working?” used to be difficult to answer. Digital display networks generated impressions, visible screens, running content, but measuring what those screens actually delivered was largely inferential. Sales went up after a campaign; the screens probably helped.
That is changing. A growing set of digital display solutions now include analytics capabilities that move the conversation from inference to measurement, audience counts, dwell time, content performance, screen health, and in some cases, the ability to connect display activity to downstream transaction data.
For buyers evaluating display solutions in 2027, analytics capability is increasingly a relevant evaluation criterion, not just for sophisticated enterprise deployments, but for any operator who wants to understand what their screens are doing and make informed decisions about content, scheduling, and network investment.
This guide covers the analytics features that actually exist in commercial display solutions today, what they measure, and what to look for when evaluating options.
The Categories of Analytics Available in Digital Display Solutions
1. Playback and Content Performance Analytics
The most basic and most universally available analytics layer. A CMS with playback reporting can tell you:
- Which content played on which screen, during which time window
- Whether scheduled content actually went live as planned, or whether a connectivity issue or hardware fault interrupted playback
- How many times a specific piece of content has played across the network over a defined period
This is the analytics foundation that every commercially serious CMS should provide. It answers the question “did our campaign actually run?”, which sounds basic but is more often unverified than operators realise. A campaign that was scheduled across 30 outlets but failed to play on 8 of them due to sync issues is a campaign that underdelivered, and without playback reporting, nobody knows.
What to verify: Does the CMS show playback logs at the screen level, or only at the network level? Screen-level reporting is significantly more useful, it allows operators to identify specific underperforming screens rather than just knowing aggregate network performance.
2. Audience Analytics
A step beyond playback reporting, audience analytics uses camera-based sensors at or near the display to measure who is actually seeing the content, not just that the content is playing.
Current audience analytics systems typically measure:
- Impression count: How many people passed within viewing range of the screen during a given period
- Attention metrics: Of those who passed, how many looked at the screen, and for how long
- Demographic segmentation: Approximate age range and gender distribution of the audience, used to understand who is engaging with which content
- Dwell time: How long individuals stayed within the viewing zone
These metrics are captured through computer vision processing, the camera sees shapes and motion, not identities. No personally identifiable information is stored or transmitted. The output is aggregate data: “between 12 and 1 PM on Tuesday, the screen received 340 impressions, 40% of which showed more than 3 seconds of attention, skewing toward the 25–40 age range.”
What this enables: Content testing. An operator can run two versions of a promotional message on different screens in comparable locations and measure which one generates more attention time. The insight feeds content strategy rather than replacing it.
What to verify: How is the sensor integrated, built into the display, attached externally, or a separate installation? What happens to the raw camera feed, is it processed locally and discarded, or transmitted to a cloud server? What is the data retention and access policy? These are the questions that determine whether the analytics implementation is operationally credible and ethically sound.
3. Screen Health and Network Monitoring Analytics
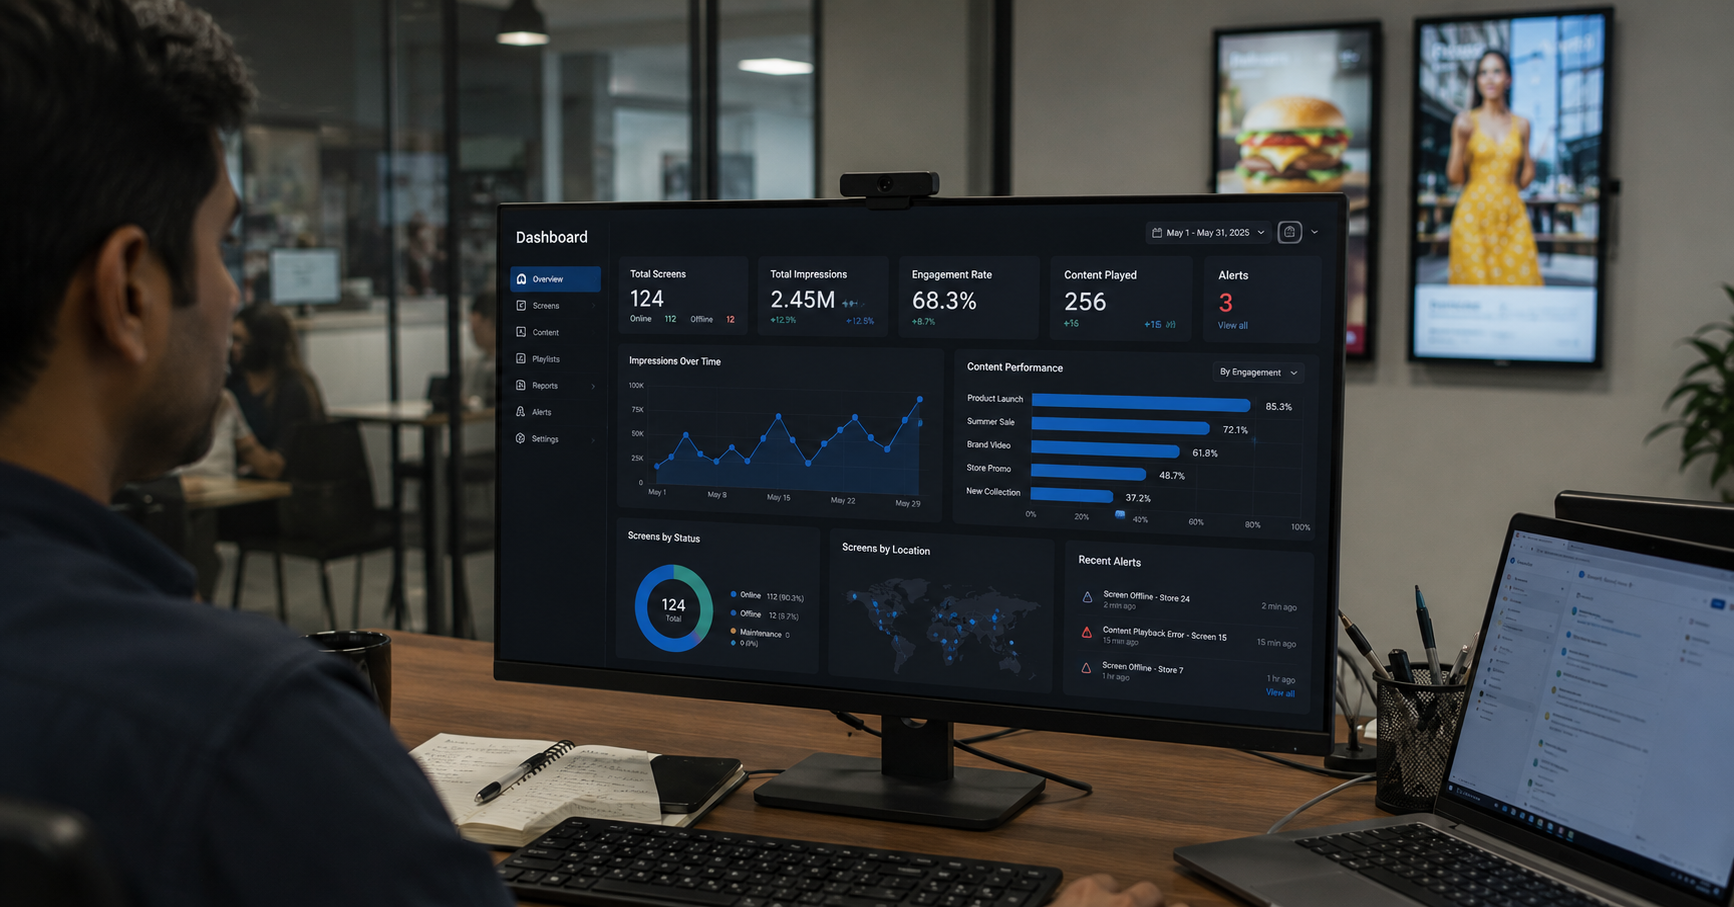
Operational analytics focused on the hardware layer rather than the audience. A well-instrumented display network provides:
- Screen uptime reporting: Which screens are on, which are off, which have been offline for an extended period
- Hardware health indicators: Temperature, fan status, media player connectivity, display brightness levels
- Alert and notification systems: Automated alerts when a screen goes offline, when a media player fails to check in, or when scheduled content hasn’t played as expected
For operators managing large networks, 50 screens across multiple cities, this operational visibility is significant. Knowing that three screens in a specific outlet have been offline for six hours is the difference between a proactive response and a store manager calling HQ to report that the displays aren’t working.
What to verify: Is screen health monitoring included in the CMS subscription or a separate tier? What is the alert mechanism, email, SMS, in-platform notification? Can alerts be routed to different people for different screen groups (operations team for hardware alerts, marketing team for content alerts)?
4. Transaction and Conversion Integration
The most commercially meaningful analytics layer, and the least commonly available in standard commercial display deployments, because it requires integration between the display system and the POS or transaction system.
When this integration exists, it becomes possible to correlate display activity with transaction outcomes:
- Did average ticket size increase on screens that showed an upsell prompt?
- Did a product’s sales velocity change during the period it was featured on the menu board?
- Is there a measurable difference in transaction volume between hours when specific content was running and hours when it wasn’t?
This is the analytics layer that moves digital signage from “we think this is working” to “here is what the screens are contributing to revenue.” For QSR operators in particular, where average ticket size and throughput are closely tracked, this level of measurement is the most commercially relevant.
What to verify: Does the display solution support POS integration, and has this been implemented in a live deployment rather than just described as possible? What POS systems has the vendor integrated with successfully? What does the reporting interface look like for correlating display and transaction data?
What the Analytics Landscape Looks Like in Practice
Most commercial CMS platforms offer playback analytics as standard. If a vendor cannot show you playback logs per screen for a defined period, the CMS is not commercially serious.
Audience analytics are available but require additional hardware investment. Camera-based audience measurement typically adds cost per screen, the sensor hardware, the processing software, and often an additional platform tier. For operators evaluating this capability, the question is whether the measurement value justifies the incremental investment at the deployment scale they’re planning.
Screen health monitoring varies significantly between platforms. Some platforms provide comprehensive operational dashboards with real-time screen status across the full network. Others provide only basic connectivity indicators. For large networks, the operational value of robust health monitoring is significant, it’s worth specifically evaluating, not assuming it’s included.
Transaction integration is available but uncommon in practice. The integration between display CMS and POS systems exists at the technical level for most major platforms, but live deployments with functioning transaction correlation reporting are less common than vendor presentations suggest. Ask for a reference deployment where this is actually operational, not a description of the integration capability.
The Analytics Questions Worth Asking Any Vendor
Before committing to a display solution on the basis of its analytics capabilities, ask these questions and ask for live demonstrations:
“Can you show me a playback report for a specific screen, for a specific week, showing which content played and when?” This tests the most basic analytics capability. If the vendor can’t produce this in two minutes from their live platform, the analytics are not genuinely implemented.
“Does the platform support audience measurement? If so, show me what the data looks like in the reporting interface.” This tests whether audience analytics is a real feature or a roadmap item.
“What screen health alerts does the platform generate? Can you show me an example of a network health dashboard for a multi-outlet deployment?” This tests operational monitoring depth.
“Do you have a live deployment where display activity is being correlated with POS transaction data? Can I speak to that operator?” This tests transaction integration reality vs. aspiration.
The Realistic Expectation
Analytics in digital display solutions is a maturing capability, not a fully solved one. Playback reporting is reliable and universally available in serious commercial platforms. Audience analytics works but requires hardware investment and thoughtful interpretation. Transaction integration is technically possible but operationally complex and genuinely rare in live Indian deployments.
Buyers should evaluate analytics features on the basis of what they can actually use, not what sounds impressive in a vendor presentation. A QSR operator who will actively use playback reports to verify campaign delivery and screen health alerts to manage a distributed network is making a realistic, valuable use of available analytics. An operator who expects AI-driven audience intelligence to automatically optimise their content without human interpretation is likely to be disappointed.
Start with what’s real and useful. Build toward what’s possible as the deployment matures.
If you’re evaluating digital display solutions and want to understand what analytics capabilities are genuinely available, and what they look like in a live deployment, we’d be glad to walk through it, including a live demonstration of xtravu DSS reporting.
Get in touch: contact@techworksworld.com | +91-99109 65918 | techworksworld.com